Accessing the Daily Snapshot Page by Location
Viewing the Daily Snapshot page allows you to review the net operating income, sales, and bank cash balance for your accounts. The below instructions will detail how to view this by location (for instructions on how to see the Overview, click here)
- Log into Edge Web
- Click “Daily Snapshot” on the left sidebar
- From the dropdown select “By Location”
- Select the store location you would like to view by using the “location” drop-down
Learn More About the Data in Daily Snapshot View
The Performance Graph
The Performance Graph details a visual of the net operating income for a specific date range. This includes total revenue, expenses, and cost of goods/services.
Selecting the Range
- From the top toolbar, click on the Location dropdown to select an individual store
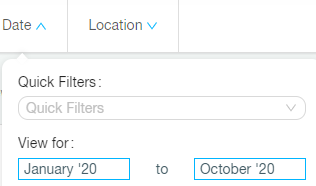
- Select the range from the “Date” dropdown.
- The “Quick Filter” dropdown includes Year-to-Date, Trailing 12 Months, and Current Month to manipulate the report
- If you wish to view a range of month(s) not included in the filter, you can select your own view by inputting the dates under "View For"
Reading the Performance Graph
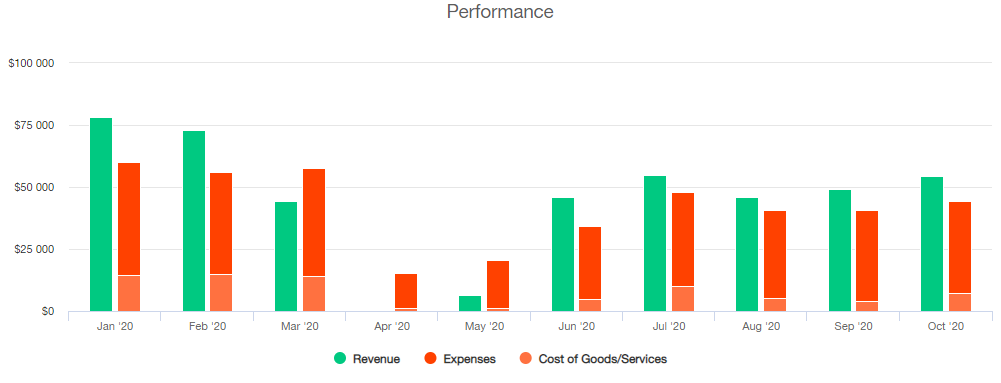
- The green bar shows total revenue (money coming in)
- The orange bars highlight the expense and cost of goods/services (money being spent)
- Hover over the bar(s) to view the dollar amount of each value
- If you only want to see certain graphs, simply click on the name of the graph you'd like to hide (for example, Cost of Goods/Services) in the bottom legend to remove it from your graph
Comments
Article is closed for comments.